Project Overview
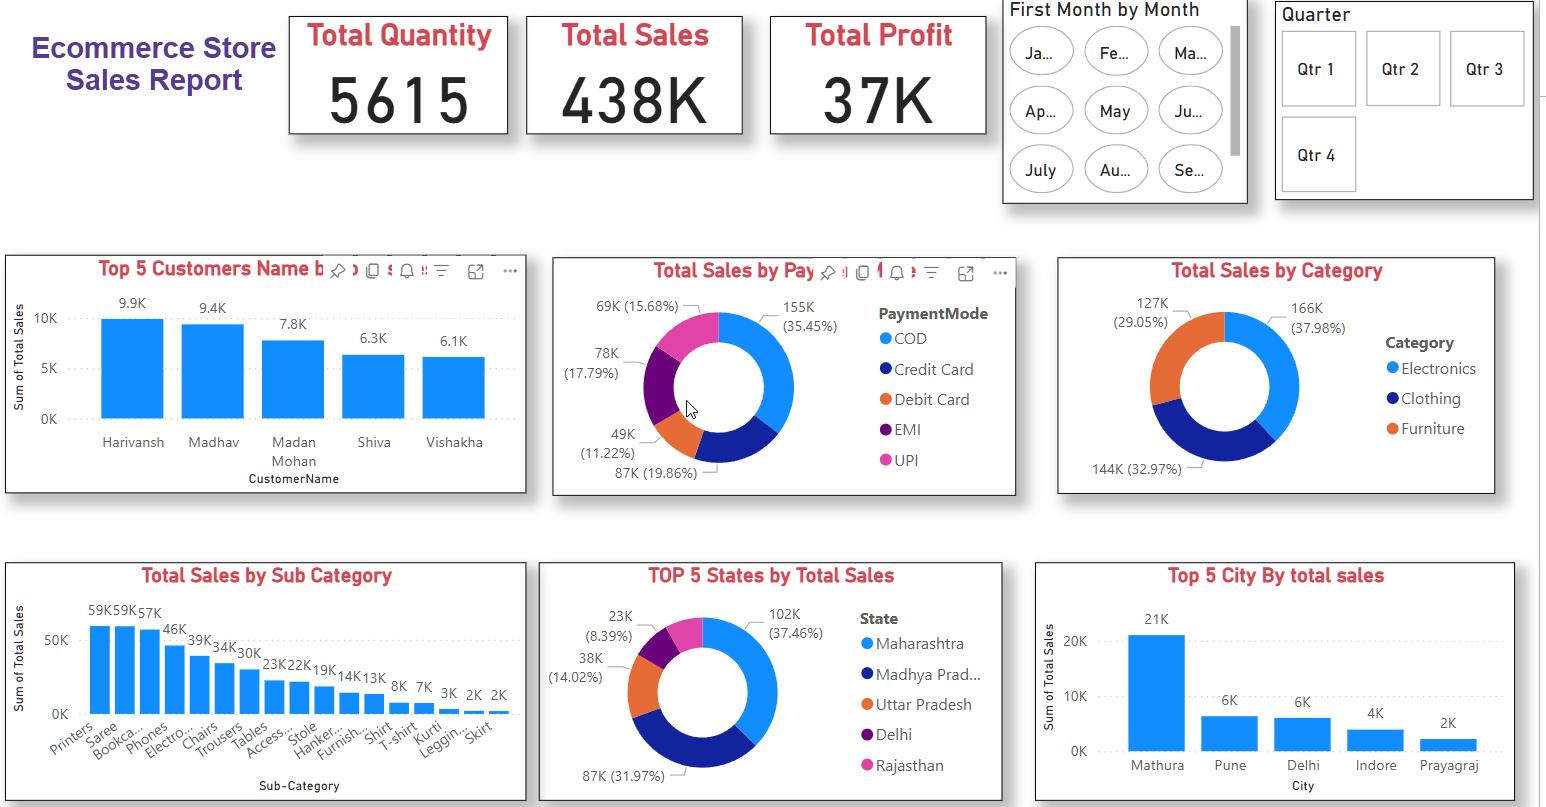
This Power BI dashboard was developed to analyze and monitor ecommerce sales data. It allows users to quickly understand key business metrics, discover trends, and identify high-performing segments across customers, products, and regions.
The dashboard includes:
- Key performance indicators for total quantity sold, total sales, and profit
- Sales distribution by payment method
- Top-performing customers, states, and cities
- Category and subcategory breakdowns
- Interactive filters for months and quarters
Key Features
| Area | Details |
|---|---|
| KPIs | Total Quantity, Sales, and Profit summarized in a high-level overview |
| Customer Insights | Top 5 customers by sales shown in a comparative bar chart |
| Payment Mode Analysis | Donut chart highlighting revenue distribution by payment methods |
| Product Category Overview | Sales segmented by category and subcategory |
| Regional Breakdown | Sales performance by state and top cities |
| Time-Based Filtering | Dynamic slicers for filtering data by month and quarter |
| DAX Implementation | Measures used for formatting, filtering logic, and calculated metrics |
Live Dashboard Access
The report is hosted on Power BI Service and publicly viewable for demonstration purposes.
Purpose of the Project
The goal of this project was to simulate a real-world business intelligence scenario where stakeholders need quick insights into operational performance. The dashboard was designed with clarity, usability, and business decision-making in mind.
Learning Outcomes
Through this project, I gained practical experience in:
- Structuring large datasets for use in Power BI
- Designing a user-friendly layout for business reports
- Implementing DAX formulas for dynamic metrics
- Publishing and embedding reports for online access
Files and Structure
Ecommerce_Sales_Report.pbix— Complete Power BI fileassets/dashboard_screenshot.png— Preview image used in README and portfolioREADME.md— Summary of project, usage, and features
Final Remarks
This project demonstrates how business intelligence tools like Power BI can be used to deliver concise and effective reporting solutions. By translating raw sales data into an interactive dashboard, I showcased both technical and analytical skills relevant to data analyst roles.
If you’re interested in the source files or how it was built, feel free to explore the GitHub repository linked above.